Arduino Monitor – An easy visualisation tool for sensor data
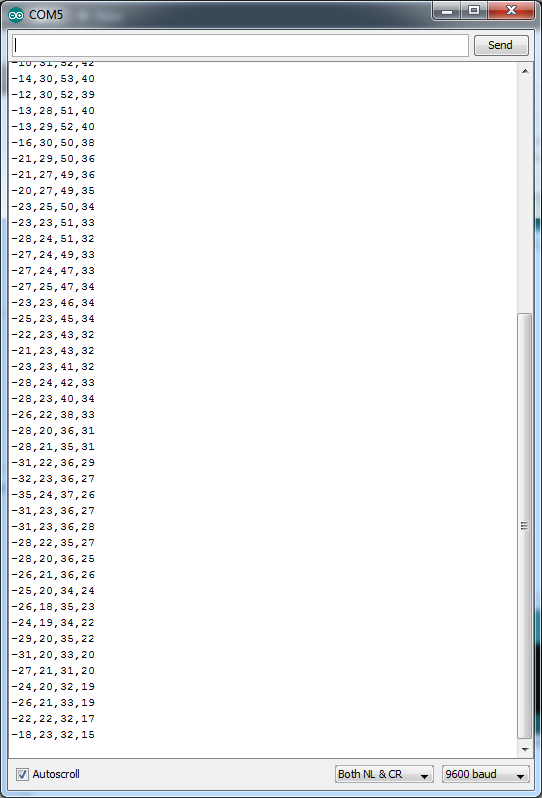
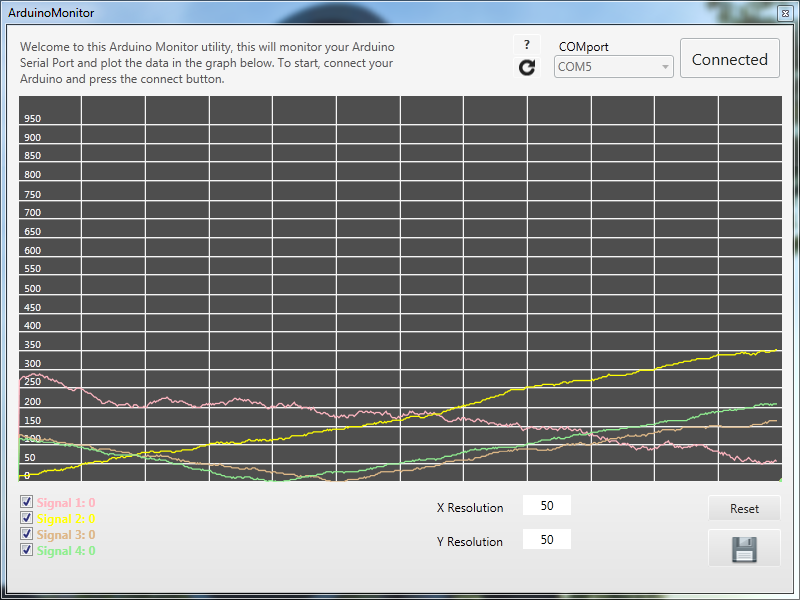
Do you have an Arduino, and are you sick and tired of staring at the Serial Monitor when trying to connect a sensor? Well then Arduino Monitor is exactly what you need! It provides a visual representation of all your sensor inputs, so you’ll have fancy graphics on your screen rather then a big list of numbers.
Features features…
- Simultaneously plotting multiple signals, with show/hide functions for individual signals.
- An easy to navigate plot area, with zoom and pan functionality in an adjustable grid.
- Export to .csv functionality to create graphs for reports or research papers.

Arduino’s Serialmonitor doesn’t provide you with easy to read information when trying to connect a sensor.
Sounds cool, How can I get it?
Well, you can download the software for free right here ArduinoMonitor 1.0. Currently, this software is windows only, so all the people with fancy macbooks or linux machines will have to continue staring at an infinite list of numbers.
Any other requirements?
- A Windows-based computer
- An Arduino microcontroller, or any other device that sends data to your serial port
- .NET framework 4.0, is essential for a lot of software, you might already have it (download here, or get it during the installation)
- A USB cable, for the connection
Installation instructions
- Download the .zip file from this location –> ArduinoMonitor 1.0
- Extract the contents of the package somewhere
- Do not open the setup.exe, open the .application file instead. This does some additional checks before installing
- If everything is correct, Arduinomonitor is added to your start menu.
- When updating, The earlier version should be removed completely before installing the newer version
Still To do
The program as it is now works fine, but I still have some “big” plans for the future. What you can expect is the following:
- Add smoothing/derivative/filter functionality to the plotter, so you can more easily see what happens with the signal when you would add one of these functions in your sketch.
- Generate C code for the above functionality to paste into your sketches.
- Add a custom graph plotter, so you’re able to compare say y=sin(x) with your input signal
- Make it easier to move around and zoom in and out.
- Add 3D functionality, to let the graphs pop off the screen!
Updates
30-8-2012: Added disconnect/connect button, extended Export functionality. Fixed a bug in the plotter.
September ’12: Arduinomonitor is now available on Github! Please refer to https://github.com/pepf/ArduinoMonitor for the latest updates on this project!
